This is an old revision of the document!
Table of Contents
Type of Error
see hypothesis testing in r space
and hypothesis testing
Type I Error
rm(list=ls())

rnorm2 <- function(n,mean,sd){
  mean+sd*scale(rnorm(n))
}

set.seed(1111)
n.p <- 10000
m.p <- 100
sd.p <- 10
p1 <- rnorm2(n.p, m.p, sd.p)
m.p1 <- mean(p1)
sd.p1 <- sd(p1)

p2 <- rnorm2(n.p, m.p+5, sd.p)
m.p2 <- mean(p2)
sd.p2 <- sd(p2)

n.s <- 40
se.z1 <- c(sqrt(var(p1)/n.s))
se.z2 <- c(sqrt(var(p2)/n.s))

x.p1 <- seq(mean(p1)-5*se.z1,
                mean(p2)+5*se.z1,
                length.out = 500)
x.p2 <- seq(mean(p2)-5*se.z1,
            mean(p2)+5*se.z1,
            length.out = 500)

# Calculate the probability
# density for a normal distribution
y.p1 <- dnorm(x.p1, mean(p1), se.z1)
y.p2 <- dnorm(x.p2, mean(p2), se.z2)

# Plot the theoretical PDF
plot(x.p1, y.p1, type = "l",
     lwd=3,
     main = "Sample means from p1 and p2 (imaginary)",
     xlab = "Value", ylab = "Density")
lines(x.p2, y.p2, lty=2, lwd=3)


m.p1 <- mean(p1)
se1 <- c(m.p1-se.z1, m.p1+se.z1)
se2 <- c(m.p1-2*se.z1, m.p1+2*se.z1)
se3 <- c(m.p1-3*se.z1, m.p1+3*se.z1)
abline(v=c(m.p1,se1,se2,se3),
       col=c('black', 'orange', 'orange',
             'green', 'green',
             'blue', 'blue'),
       lwd=1)

treated.s <- sample(p2, n.s)
m.treated.s <- mean(treated.s)
# m.treated.s <- 103.1605 # set.seed(101)에서 얻은 treated.s 점수를 유지
abline(v=m.treated.s, col='red', lwd=2)

se.z1

diff <- m.treated.s-mean(p1)
diff/se.z1

# usual way - using sample's variance
# instead of p1's variance to get
# standard error value
se.s <- sqrt(var(treated.s)/n.s)
se.s
diff/se.s

pt(diff/se.s, df=n.s-1,
   lower.tail = F) * 2
t.test(treated.s, mu=m.p1, var.equal = T)
output
>
> rm(list=ls())
>
> rnorm2 <- function(n,mean,sd){
+   mean+sd*scale(rnorm(n))
+ }
>
> set.seed(1111)
> n.p <- 10000
> m.p <- 100
> sd.p <- 10
> p1 <- rnorm2(n.p, m.p, sd.p)
> m.p1 <- mean(p1)
> sd.p1 <- sd(p1)
>
> p2 <- rnorm2(n.p, m.p+5, sd.p)
> m.p2 <- mean(p2)
> sd.p2 <- sd(p2)
>
>
…………………….
> n.s <- 40
> se.z1 <- c(sqrt(var(p1)/n.s))
> se.z2 <- c(sqrt(var(p2)/n.s))
>
> x.p1 <- seq(mean(p1)-5*se.z1,
+                 mean(p2)+5*se.z1,
+                 length.out = 500)
> x.p2 <- seq(mean(p2)-5*se.z1,
+             mean(p2)+5*se.z1,
+             length.out = 500)
>
> # Calculate the probability
> # density for a normal distribution
> y.p1 <- dnorm(x.p1, mean(p1), se.z1)
> y.p2 <- dnorm(x.p2, mean(p2), se.z2)
>
> # Plot the theoretical PDF
> plot(x.p1, y.p1, type = "l",
+      lwd=3,
+      main = "Sample means from p1 and p2 (imaginary)",
+      xlab = "Value", ylab = "Density")
> lines(x.p2, y.p2, lty=2, lwd=3)
>
>
> m.p1 <- mean(p1)
> se1 <- c(m.p1-se.z1, m.p1+se.z1)
> se2 <- c(m.p1-2*se.z1, m.p1+2*se.z1)
> se3 <- c(m.p1-3*se.z1, m.p1+3*se.z1)
> abline(v=c(m.p1,se1,se2,se3),
+        col=c('black', 'orange', 'orange',
+              'green', 'green',
+              'blue', 'blue'),
+        lwd=1)
>
> treated.s <- sample(p2, n.s)
> m.treated.s <- mean(treated.s)
> m.treated.s
[1] 102.4867
> # m.treated.s <- 103.1605
> # set.seed(101)에서 얻은 treated.s 점수를 유지
> abline(v=m.treated.s, col='red', lwd=2)
>
…………………….

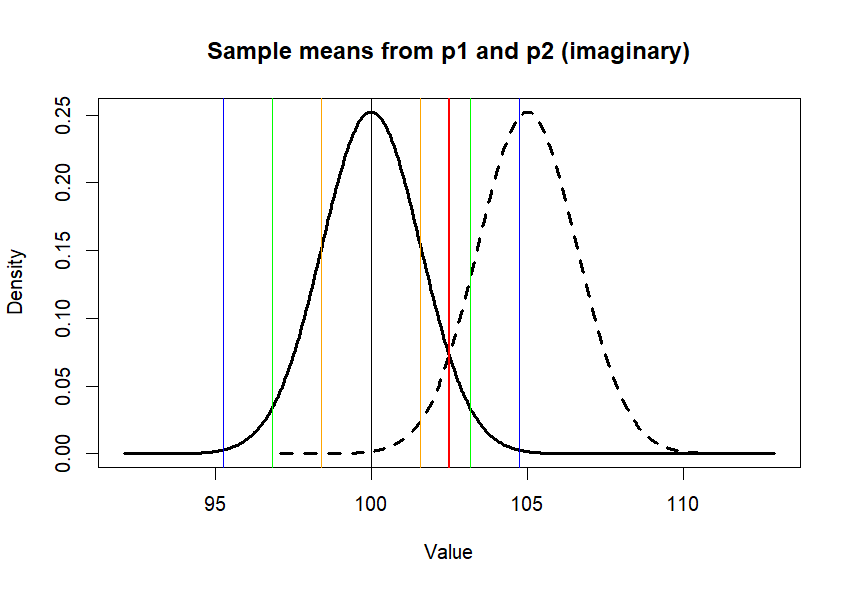
검은색 실선 (distribution of means)
검은색 선 (mean of p1, 100)
노란색 (+- se)
연두색 (+- 2se)
파란색 (+- 3se)
검은색 점선 (distribution of means from p2, 평균 = 105): 약을 먹고 머리가 좋아진 모집단. 105로 5만큼 좋아졌다고 가정한 것. 사실, 머리가 좋아지는 약을 개발했다면 그 약을 먹은 모집단의 파라미터는 알수가 없다. 단지 105라고 가정한 것이다.
붉은색 (a sample from p2) = 102.4867 : 이 점수는 105점 집단에서 (p2) 나온 n=40의 샘플. 이 샘플은 p2에서 추출되었기에 105점의 모집단에 속한 샘플이다.
그러나, 이 샘플의 평균이 p1에 속한다고 하고, 이 평균값이 나올 확률을 알아보려면
pnorm(m.treated.s, mean=m.p1, sd=se.z, lower.tail=F) * 2
일 것이다.
> se.z1
[1] 1.581139
>
> diff <- m.treated.s-mean(p1)
> diff/se.z1
[1] 1.572729
>
> # usual way - using sample's variance
> # instead of p1's variance to get
> # standard error value
> se.s <- sqrt(var(treated.s)/n.s)
> se.s
[1] 1.567184
> diff/se.s
[1] 1.586733
>
> pt(diff/se.s, df=n.s-1,
+    lower.tail = F) * 2
[1] 0.1206489
> t.test(treated.s, mu=m.p1, var.equal = T)

	One Sample t-test

data:  treated.s
t = 1.5867, df = 39, p-value = 0.1206
alternative hypothesis: true mean is not equal to 100
95 percent confidence interval:
  99.31677 105.65663
sample estimates:
mean of x
 102.4867

>
cm.treated.s = 102.4867 -- > RED LINE
This red line came from p2, whose mean is different from p1's. We know that p2's mean is 5 greater than p1's (100). And red line (mean of a sample from p2, whose sample size (s.size) 40. So the truth is that we should deny null hypothesis, and accept the alternative (research) one. But, because of the value, m.treated.s we could not. We failed to find out the truth (ERROR). This kind of error is called Type I Error.
