r:dummy_variables_with_significant_interaction
This is an old revision of the document!
Regression with two categorical variables (IVs): Two way anova
college <- read.csv("http://commres.net/wiki/_media/r/college.csv")
attach(college)
str(college)
head(college)

salary <- salary / 1000

public<-factor(public, c(0,1), labels=c('Private', 'Public'))
location<-factor(location, c(1,2,3,4), labels=c('S', 'MW','NE', 'W'))

m1 <- lm(salary~public+location)
m2 <- lm(salary~public*location)

summary(m1)
summary(m2)

a.m2 <- aov(salary~public*location)
summary(a.m2)

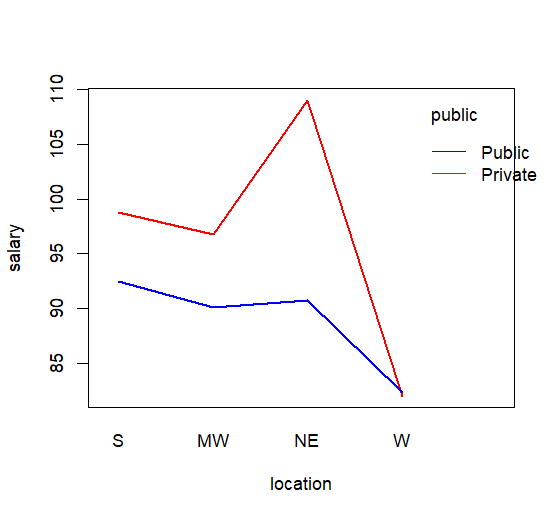
interaction.plot(x.factor = location,
                 trace.factor = public,
                 response = salary,
                 fun = median,
                 ylab = "salary",
                 xlab = "location",
                 col=c("red", "blue"),
                 lty = 1,
                 lwd=2,
                 trace.label="public")
output
####################
> college <- read.csv("http://commres.net/wiki/_media/r/college.csv")
> attach(college)
The following object is masked from acne.re (pos = 36):

    id

The following object is masked from acne.re (pos = 37):

    id

> str(college)
'data.frame':	85 obs. of  6 variables:
 $ id      : int  1 2 3 4 5 6 7 8 9 10 ...
 $ name    : chr  "Massachusetts Institute of Technology (MIT)" "Harvard University" "Dartmouth College" "Princeton University" ...
 $ salary  : num  119000 121000 123000 123000 110000 112000 111000 117000 111000 104000 ...
 $ cost    : int  189300 189600 188400 188700 194200 181900 191300 187600 180400 184900 ...
 $ public  : int  0 0 0 0 0 0 0 0 0 0 ...
 $ location: int  3 3 3 3 3 2 3 1 3 3 ...
> head(college)
  id                                        name salary   cost public location
1  1 Massachusetts Institute of Technology (MIT) 119000 189300      0        3
2  2                          Harvard University 121000 189600      0        3
3  3                           Dartmouth College 123000 188400      0        3
4  4                        Princeton University 123000 188700      0        3
5  5                             Yale University 110000 194200      0        3
6  6                    University of Notre Dame 112000 181900      0        2
> salary <- salary / 1000
> public<-factor(public, c(0,1), labels=c('Private', 'Public'))
> location<-factor(location, c(1,2,3,4), labels=c('S', 'MW','NE', 'W'))
> m1 <- lm(salary~public+location)
> m2 <- lm(salary~public*location)
> summary(m1)

Call:
lm(formula = salary ~ public + location)

Residuals:
   Min     1Q Median     3Q    Max
-17.15  -4.75  -0.35   2.85  31.67

Coefficients:
             Estimate Std. Error t value Pr(>|t|)
(Intercept)     99.56       1.90   52.30  < 2e-16 ***
publicPublic    -7.30       1.83   -3.99  0.00014 ***
locationMW      -2.40       2.52   -0.95  0.34366
locationNE       8.79       2.39    3.68  0.00042 ***
locationW      -10.93       2.49   -4.39  3.4e-05 ***
---
Signif. codes:  0 ‘***’ 0.001 ‘**’ 0.01 ‘*’ 0.05 ‘.’ 0.1 ‘ ’ 1

Residual standard error: 7.86 on 80 degrees of freedom
Multiple R-squared:  0.587,	Adjusted R-squared:  0.566
F-statistic: 28.4 on 4 and 80 DF,  p-value: 1.06e-14

> summary(m2)

Call:
lm(formula = salary ~ public * location)

Residuals:
   Min     1Q Median     3Q    Max
-11.19  -4.88  -0.65   2.49  27.55

Coefficients:
                        Estimate Std. Error t value Pr(>|t|)
(Intercept)               99.492      2.006   49.60  < 2e-16 ***
publicPublic              -7.142      3.172   -2.25   0.0272 *
locationMW                -1.982      2.975   -0.67   0.5074
locationNE                11.393      2.537    4.49  2.5e-05 ***
locationW                -17.554      3.172   -5.53  4.1e-07 ***
publicPublic:locationMW   -0.913      4.500   -0.20   0.8398
publicPublic:locationNE  -12.843      4.704   -2.73   0.0078 **
publicPublic:locationW    10.650      4.451    2.39   0.0192 *
---
Signif. codes:  0 ‘***’ 0.001 ‘**’ 0.01 ‘*’ 0.05 ‘.’ 0.1 ‘ ’ 1

Residual standard error: 6.95 on 77 degrees of freedom
Multiple R-squared:  0.689,	Adjusted R-squared:  0.661
F-statistic: 24.4 on 7 and 77 DF,  p-value: <2e-16
>
>
> a.m2 <- aov(salary~public*location)
> summary(a.m2)
                Df Sum Sq Mean Sq F value  Pr(>F)
public           1   2970    2970   61.50 2.0e-11 ***
location         3   4057    1352   28.01 2.4e-12 ***
public:location  3   1225     408    8.46 6.3e-05 ***
Residuals       77   3718      48
---
Signif. codes:  0 ‘***’ 0.001 ‘**’ 0.01 ‘*’ 0.05 ‘.’ 0.1 ‘ ’ 1
>
>
> interaction.plot(x.factor = location,
+                  trace.factor = public,
+                  response = salary,
+                  fun = median,
+                  ylab = "salary",
+                  xlab = "location",
+                  col=c("red", "blue"),
+                  lty = 1,
+                  lwd=2,
+                  trace.label="public")
>
r/dummy_variables_with_significant_interaction.1685638091.txt.gz · Last modified: by hkimscil

